
A delay of even a second can change whether a page gets used, indexed, or skipped. On documentation and developer sites, that matters twice. Human readers lose patience, and AI systems spend less time fetching and interpreting pages that are slow, heavy, or unstable.
For docs teams, page speed affects more than user experience. It affects whether your product surfaces in AI-generated answers, coding assistants, and answer engines. If your docs are hard to load or render cleanly, they are harder to extract, chunk, and cite. That is a discoverability problem, not just a performance problem. Teams working on answer engine optimization for product documentation should treat speed as part of content distribution.
I have seen this play out in docs stacks that look fine in Lighthouse but still feel slow in real use because search pages ship too much JavaScript, reference pages load oversized assets, or client-side rendering delays meaningful content. A fast-looking score is useful. Fast retrieval and clean HTML are what help both readers and machines.
There is still a business case in the usual sense. Faster pages reduce abandonment and improve conversion paths. PageSpeed Plus explains why it matters. For developer sites, the stronger point is simpler: fast docs get read, parsed, and recommended more often.
Table of Contents#
- Why Speed Is No Longer Just a UX Metric
- Front-End Fixes That Deliver The Biggest Wins
- Back-End Tuning for Instantaneous Loads
- Verifying Fixes and Automating Performance
- Conclusion Fast Docs Are Your Best Growth Hack
Why Speed Is No Longer Just a UX Metric#
The overlooked part is what happens before a human even lands on the page.
Documentation is now read by crawlers, answer engines, copilots, and retrieval systems that decide whether your product gets cited at all. They do not browse with patience. They fetch, parse, extract, rank, and leave. If your docs arrive slowly, hydrate late, or hide core content behind client-side rendering, those systems often get an incomplete page or move on to a faster source.
That has a direct business consequence. Fast docs help users solve problems, start trials, and trust your product. They also improve the odds that AI systems can quote your docs accurately and surface your product during research. For developer marketing teams, support teams, and product-led growth teams, performance affects discovery as much as conversion.
Practical rule: If your docs are slow to render and hard to parse, they are easier to ignore.
Speed also changes how well your content survives the trip from browser to index to answer engine. Human readers want pages that feel immediate and stable. AI systems want HTML they can process quickly, headings that make sense, and code examples that appear without waiting on a pile of JavaScript. The same engineering choices usually help both.
Search is part of this, but it is not the whole story. PageSpeed Plus explains why it matters from a search perspective. Documentation teams should add another question: can an AI system fetch this page and extract the answer cleanly enough to trust it? That is one reason performance work belongs beside answer engine optimization for AI discovery, not in a separate backlog.
Lab data and field data tell different stories#
Lighthouse is useful. It is not enough.
Lab data shows how a page behaves in a controlled run. That makes it good for spotting regressions after a deploy, testing a suspected bottleneck, or comparing two implementations without noisy network conditions.
Field data shows what real visitors experienced on real devices, with old phones, weak Wi-Fi, corporate VPNs, and overloaded mobile networks. Documentation traffic is full of those conditions. Engineers read docs from trains, conference venues, customer environments, and remote desktops. A page that passes a lab test can still feel slow where it counts.
Use lab data to find the cause. Use field data to decide whether the cause is hurting people.
Choose tools by job, not popularity#
Different tools answer different questions. One dashboard will not cover all of them.
| Tool | Data Type | Best For |
|---|---|---|
| Lighthouse | Lab | Fast local checks, regression spotting, basic audits |
| WebPageTest | Lab | Waterfalls, request chains, render timing, asset priority |
| RUM | Field | Real-user behavior across devices, geographies, and network conditions |
When the problem turns out to be server delay, cache misses, slow origin responses, or inconsistent latency under load, browser tuning is only part of the fix. This guide on latency of response across systems is useful because it covers application delay, infrastructure delay, and network delay together.
The lazy loading mistake that hurts LCP#
Blanket lazy loading is one of the fastest ways to hurt the page you meant to improve.
The common failure is delaying the Largest Contentful Paint image. If the browser waits to fetch the main screenshot, hero image, or top-of-page illustration, the page feels late even when everything else is optimized. SpeedCurve explains that problem well in its write-up on neglected page speed optimizations.
Do not lazy load the image the reader is waiting to see.
On documentation sites, that often means the first product screenshot, architecture diagram, or code example visual near the top of the article. Prioritize that asset. Give it explicit dimensions. Preload it when needed. Let the assets below the fold wait.
A clean diagnosis usually comes down to four questions:
- What is late first: server response, render-blocking assets, large media, or JavaScript execution?
- What is visually important: the element readers need immediately, not the element that is easiest to optimize.
- What shifts: missing dimensions, font swaps, and injected UI often hurt perceived quality more than teams expect.
- What repeats across templates: one bad docs layout can slow every article, changelog, and API reference page.
Front-End Fixes That Deliver The Biggest Wins#
The fastest front-end improvements are rarely glamorous. They're usually about shipping less, prioritizing better, and stopping the browser from doing unnecessary work.
This is the front-end shortlist I'd start with on almost any documentation site.
Start with images because they usually dominate the page#
Images are still the easiest place to win big. Hosting.com's speed guide notes that resizing images to match layout dimensions and switching from JPEG to AVIF can reduce file sizes by over 80%. The same source also recommends preloading critical fonts and limiting font weights to 400 and 700 to reduce blocking time and improve LCP.
That means no more uploading a giant screenshot and displaying it inside a narrow content column. If the image renders at article width, export it at article width. If a diagram sits below the fold, lazy load it. If it's the first meaningful visual on the page, don't.
Here's the trade-off in one visual.
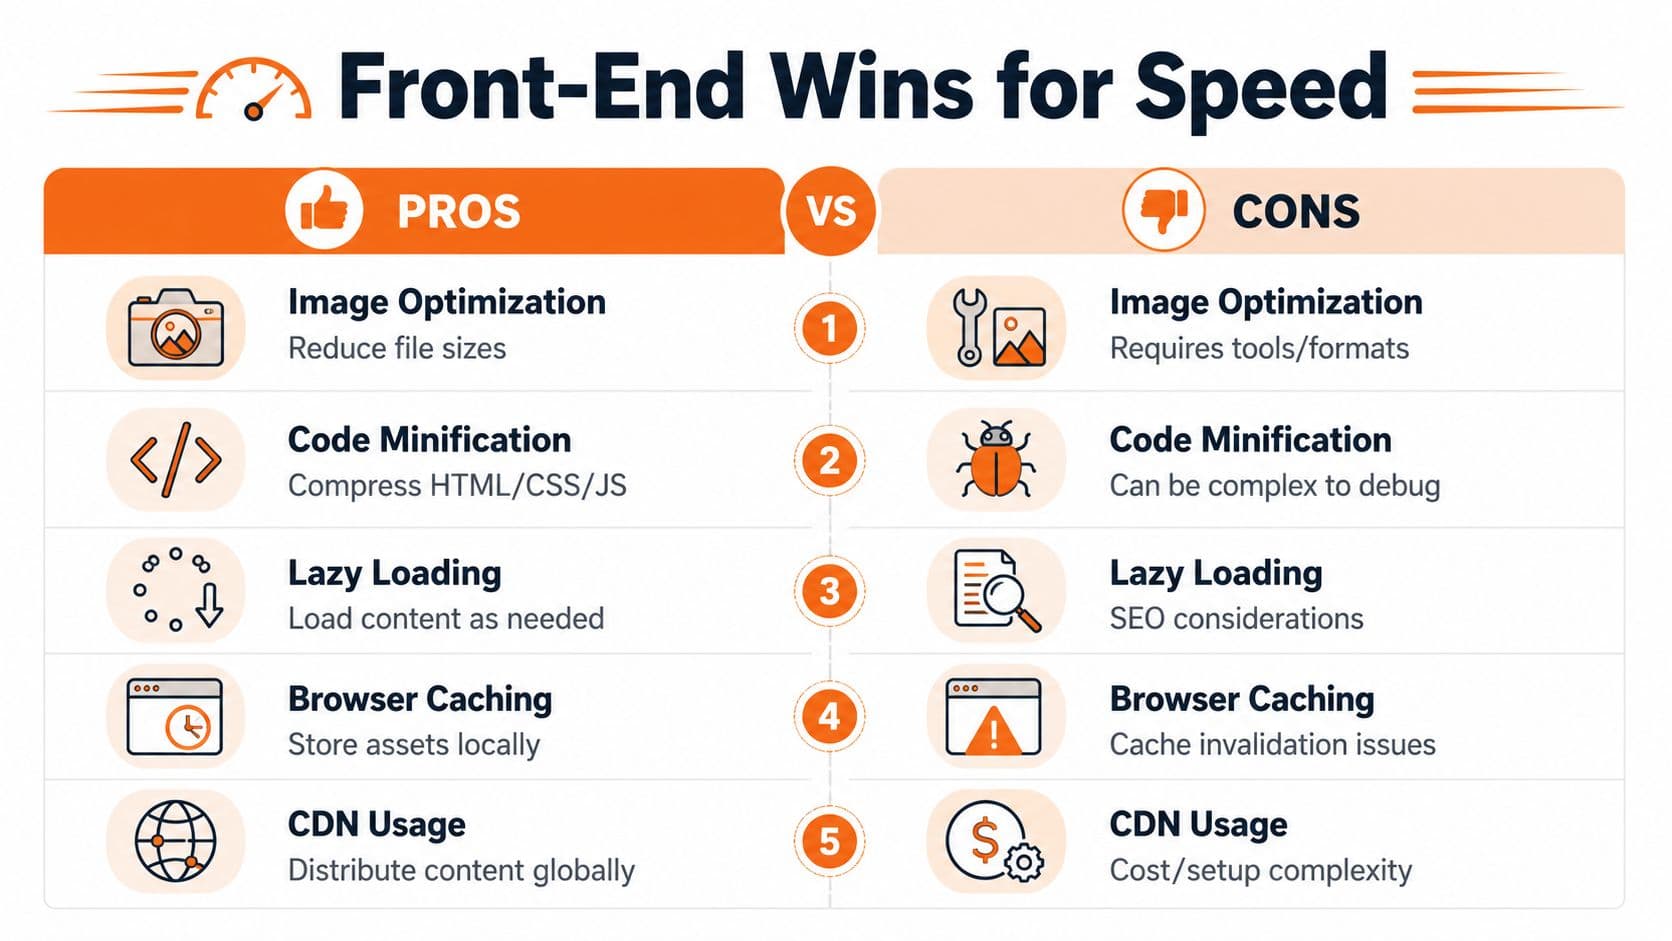
A practical image policy for docs looks like this:
- Match source to display size: Product screenshots, diagrams, and team headshots should be exported near the rendered width.
- Use modern formats selectively: AVIF is usually the first choice for static imagery. WebP is still useful when compatibility or tooling is simpler.
- Protect the hero asset: Never apply blanket lazy loading to the image that defines LCP.
- Set dimensions explicitly: Width and height reduce layout instability and help the browser reserve space before the file lands.
Then reduce render blockers#
After images, fonts and CSS usually decide whether the page feels instant or sluggish.
Keep font usage boring. Two families are enough for most docs. Two weights are enough for almost every docs UI. Anything beyond that increases file count, parsing overhead, and layout complexity. The browser doesn't care that a third display face looked nice in Figma.
Working heuristic: If removing a font weight changes aesthetics more than comprehension, remove it.
Preload only the assets that matter to above-the-fold rendering. Teams often over-preload and recreate the very congestion they're trying to solve. A narrow set of critical resources wins. A giant preload list doesn't.
This short walkthrough from Dokly's YouTube channel is a useful companion if you want to think in terms of page composition rather than isolated tricks.
Cut JavaScript with intent#
Documentation sites often ship far more JavaScript than they need. Search modals, feedback widgets, tab systems, code copy buttons, analytics overlays, cookie banners, and third-party embeds all compete for the main thread.
The fix isn't “remove JavaScript” as a slogan. It's to separate essential behavior from decorative behavior.
- Defer non-critical UI: Interactive pieces outside the first viewport can wait.
- Load by template: API reference pages may need different scripts than blog pages or changelogs.
- Audit plugins aggressively: Many frameworks load code globally even when a feature appears on one page.
- Replace heavy widgets: A simple native element often beats a dependency with a polished demo and a bloated payload.
On doc platforms like Docusaurus, a lot of this becomes manual. You inspect bundles, override defaults, tune image handling, rethink plugin behavior, and test repeatedly. That's manageable for a performance-minded team. It's overhead for everyone else. Mintlify hides more of that setup, but you still work within its opinions. The important lesson isn't which brand wins a feature checklist. It's that front-end performance improves fastest when the system starts clean and stays strict.
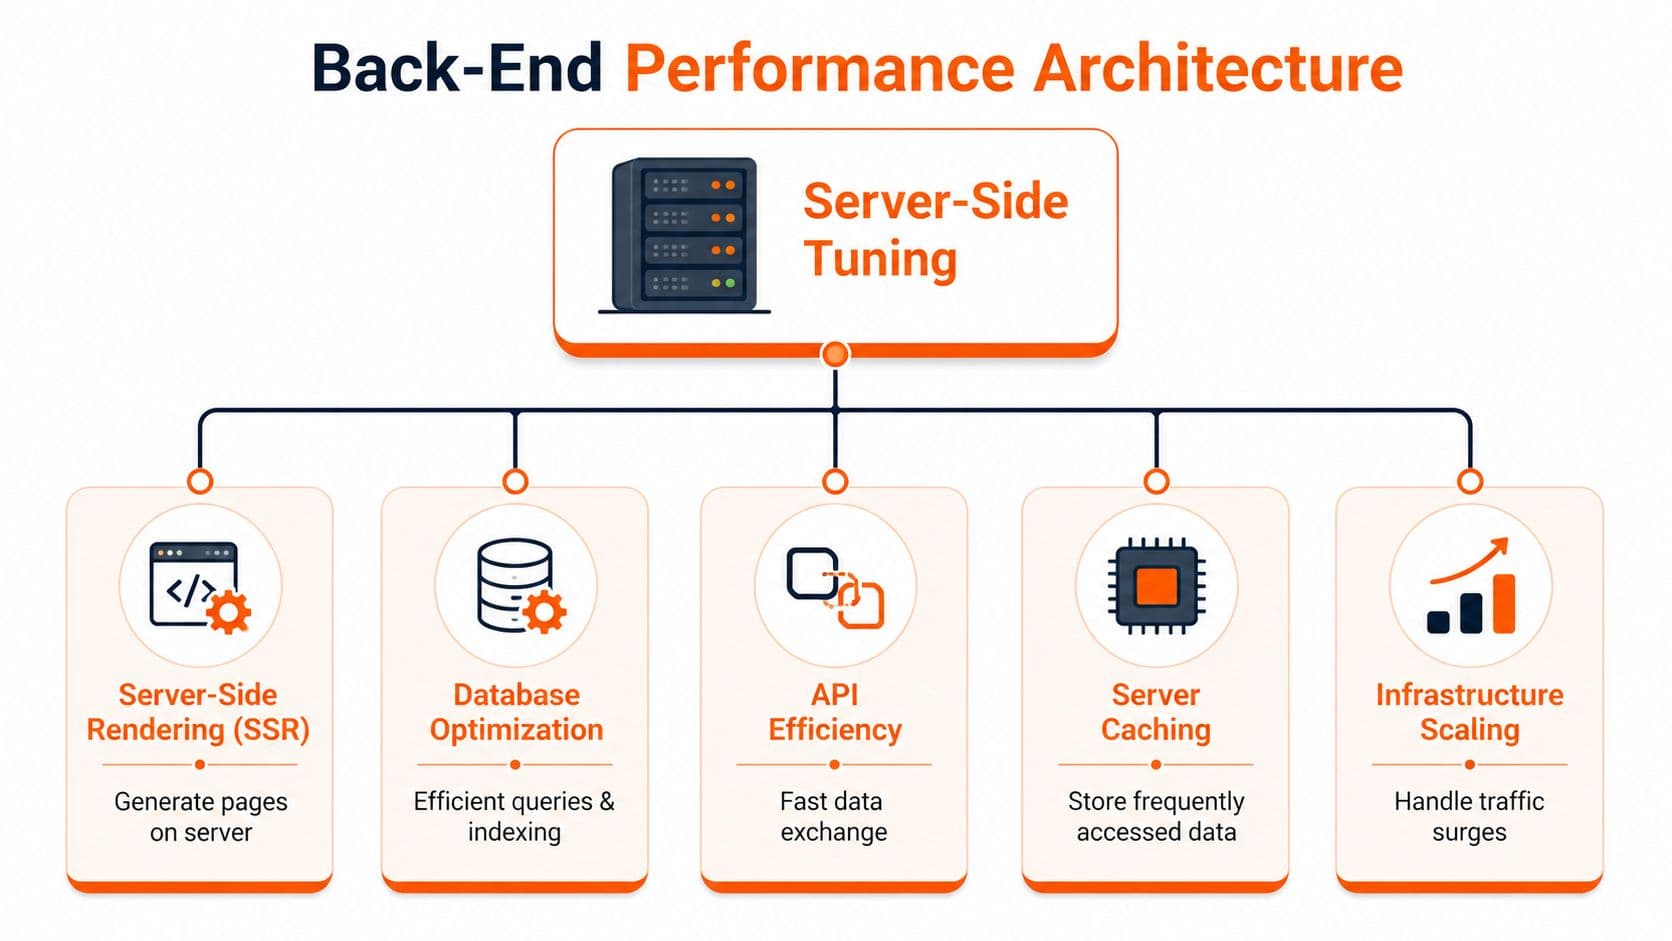
Back-End Tuning for Instantaneous Loads#
Front-end fixes help. Architecture decides your ceiling.
A documentation page that arrives as a mostly complete document is easier for browsers, easier for crawlers, and easier for AI systems than a page that ships an empty shell and assembles itself in the client. That's why server-side rendering usually beats client-heavy rendering for docs.
Architecture beats patchwork#
The browser can't paint what the server hasn't sent. If your first response is thin and your real content appears only after hydration, users wait longer and parsers do more work. That's a bad bargain for a content-heavy property.
For documentation, server-side rendering is usually the sensible default because it improves first paint quality and reduces dependency on JavaScript execution for core content. Static generation can also be excellent when content changes on a predictable publishing cycle. The key is the same in both cases: send meaningful HTML early.
That architectural choice matters even more on pages with long API references, code examples, versioned content, and localized variants. Those pages already carry complexity. Don't add avoidable render complexity on top.
A related engineering habit is to keep runtime configuration under control. Sloppy environment handling can create inconsistent builds, cache misses, and deployment surprises. This guide to Next.js environment variables is worth keeping handy if your docs stack sits inside a Next.js workflow.
Caching and delivery decide whether speed holds up#
Once the page architecture is sound, delivery becomes the next lever.
A global CDN reduces the distance between users and assets. Smart caching keeps repeat requests from hitting origin unnecessarily. Modern protocols improve transport efficiency. None of this is flashy, but it's where “pretty fast in testing” becomes “consistently fast in production.”
Three back-end habits pay off repeatedly:
- Cache what's stable: Documentation assets, generated pages, and static media should be served from the edge whenever possible.
- Eliminate wasteful requests: Broken asset references and unnecessary lookups add delay and clutter the waterfall.
- Make origin boring: The best doc origin server is the one doing as little work as possible for common requests.
There's also a business trade-off here. You can build and maintain this stack yourself with a framework plus CDN plus custom caching policy plus deployment discipline. Many teams do. The cost isn't only infrastructure. It's the engineering attention required to keep performance from drifting every time someone adds a plugin, script, or feature.
Verifying Fixes and Automating Performance#
Performance work fails when teams stop after the first “good” result.
Every change needs a before-and-after check. That sounds obvious, but a lot of teams optimize three things at once, rerun Lighthouse once, and can't tell which change helped. Keep the loop tight. Change one major variable, re-test, compare the waterfall, and confirm the fix held in real usage.
Re-test with discipline#
Use the same page template, same network assumptions, and same testing tool when you compare results. If you resize hero images, don't also swap analytics and rewrite CSS in the same pass unless you're comfortable losing attribution.
White Label IQ's page speed guide notes that 99/100 PageSpeed scores are achievable when image size matches the viewport and WebP or AVIF conversion is automated. The same source says applying decoding='async' to <img> tags can cut mobile render delay by up to 150ms. Those are good examples of changes that are easy to verify if your test process is disciplined.
A solid review pass checks for these outcomes:
- The target metric improved: Don't celebrate if CLS got better while LCP worsened and that was the main problem.
- The page still works: Performance gains that break search, navigation, or embedded code samples aren't wins.
- The fix scales across templates: One optimized article isn't enough if the docs index, changelog, and API pages still lag.
Protect the gains with budgets#
The easiest way to lose speed is to treat it as cleanup instead of policy.
Set a performance budget. That can mean limiting total JavaScript, restricting font variants, requiring dimensions on editorial images, or blocking merges when key page templates regress. The exact thresholds depend on your stack, but the principle is stable: performance needs a guardrail.
This channel snapshot is a reminder that performance work belongs in regular publishing operations, not occasional rescue projects.
Teams that care about docs as a product surface should also track what readers do after the page loads. That's where documentation analytics and metrics become useful. If speed improves but users still don't find the right answers, the bottleneck may be structure, search relevance, or content design rather than raw load time.
Fast pages are easier to trust. Measured pages are easier to improve.
Conclusion Fast Docs Are Your Best Growth Hack#
The workflow is straightforward. Diagnose the primary bottleneck. Prioritize the fixes that affect rendering most. Ship the change cleanly. Verify that it improved the page you meant to improve. Then automate enough guardrails that the gain sticks.
What's changed is the reason this work matters.
Documentation performance used to sit in a narrow UX bucket. Now it shapes discovery. Human readers judge credibility within moments of landing on a page. AI systems judge whether your content is easy to fetch, parse, and cite. In both cases, a fast doc set has an advantage over a slow, script-heavy, unstable one.
That's also why generic advice often falls short for docs. A marketing homepage can get away with more visual excess. A developer site can't. It needs quick response, stable structure, predictable rendering, and assets that don't fight the browser. If you're operating on WordPress, IMADO's WordPress expertise gives a practical view of the platform-specific tuning involved. The bigger lesson applies everywhere: speed comes from disciplined systems, not plugin accumulation.
If you're choosing between documentation platforms, then the trade-off becomes obvious. Docusaurus gives strong flexibility but often asks teams to own more setup and performance hygiene. Mintlify delivers polished docs, but you're still working within a fixed product surface. GitBook is easy to start with, yet teams that care particularly about machine-readable structure and performance often outgrow generic defaults. The winning choice is the one that makes fast, parseable documentation the baseline rather than a side project.
In 2026, fast docs don't just feel better. They get surfaced, understood, and recommended more reliably. That makes page speed one of the few technical improvements that touches UX, support, onboarding, conversion, and AI visibility at the same time.
If you want documentation that's fast by default and built for both humans and AI agents, Dokly is the practical choice. It gives teams clean, server-side rendered docs, structured MDX output, built-in analytics, AI-ready files, and a visual editing workflow without the usual setup tax. You can also explore Dokly's utilities through its tools library at Dokly Tools.